
- Joined
- Apr 7, 2017
- Messages
- 13,099
- Reaction score
- 1,193
- Points
- 649
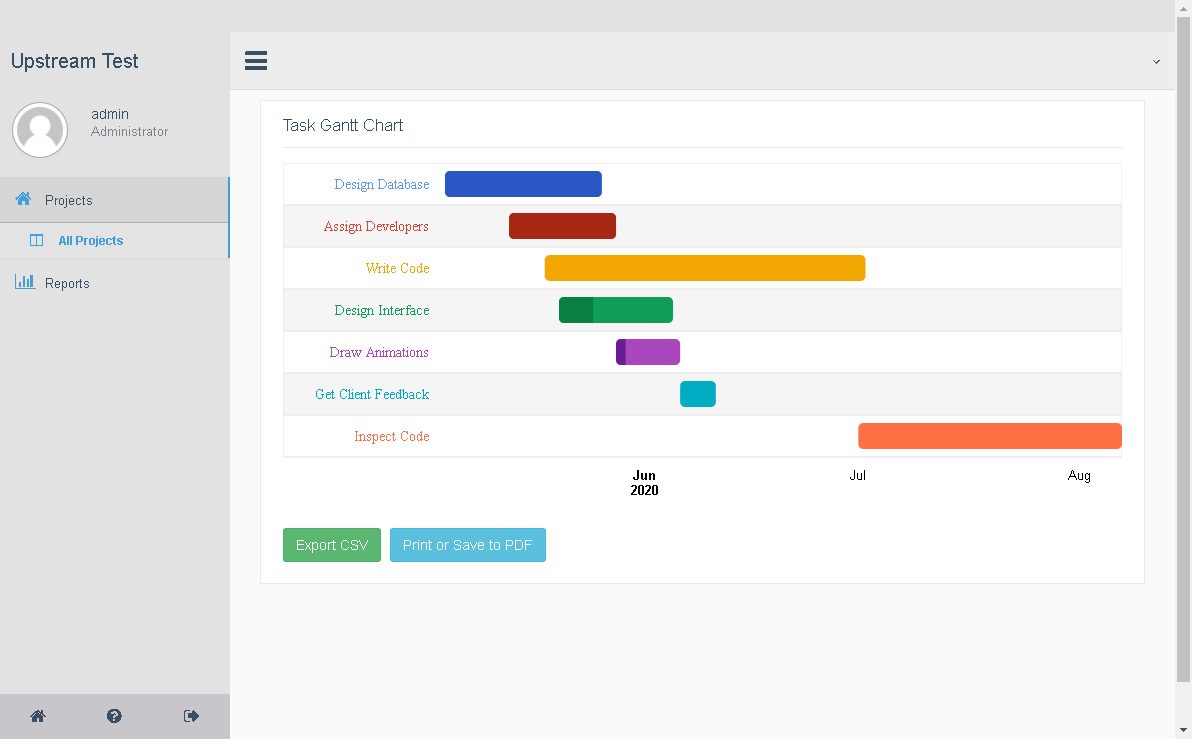
With the UpStream Reporting extension, you can create Gantt Charts, pie charts, bar graphs, calendars, tables, and more. Choose from dozens of built-in reports, and filter by any combinations of parameters or custom fields to zero in on the data that you want to see.
 upstreamplugin.com
If file/file`s you need is yet not uploaded message us asap!
Write here:
Gmail : [email protected]
Whatsapp : https://wa.me/447490565423
Instagram : https://ig.me/m/mmolearn_com
Messenger : https://m.me/100085355035309
Skype : https://join.skype.com/invite/ATRdW9nB0bSh
Telegram : https://t.me/mmolearn
Reports - UpStream
UpStream Reporting includes dozens of built in reports, with filters for every parameter, allowing you to see your data in more ways than ever. With the UpStrea
If file/file`s you need is yet not uploaded message us asap!
Write here:
Gmail : [email protected]
Whatsapp : https://wa.me/447490565423
Instagram : https://ig.me/m/mmolearn_com
Messenger : https://m.me/100085355035309
Skype : https://join.skype.com/invite/ATRdW9nB0bSh
Telegram : https://t.me/mmolearn
Attachments