
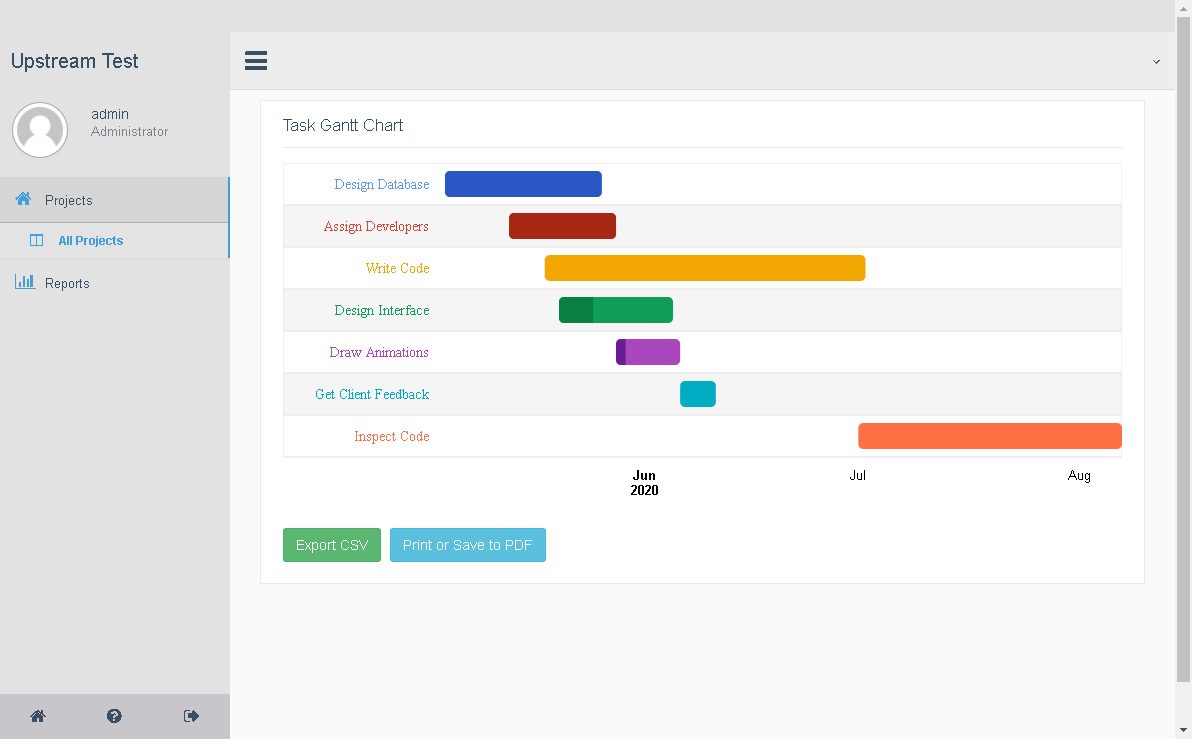
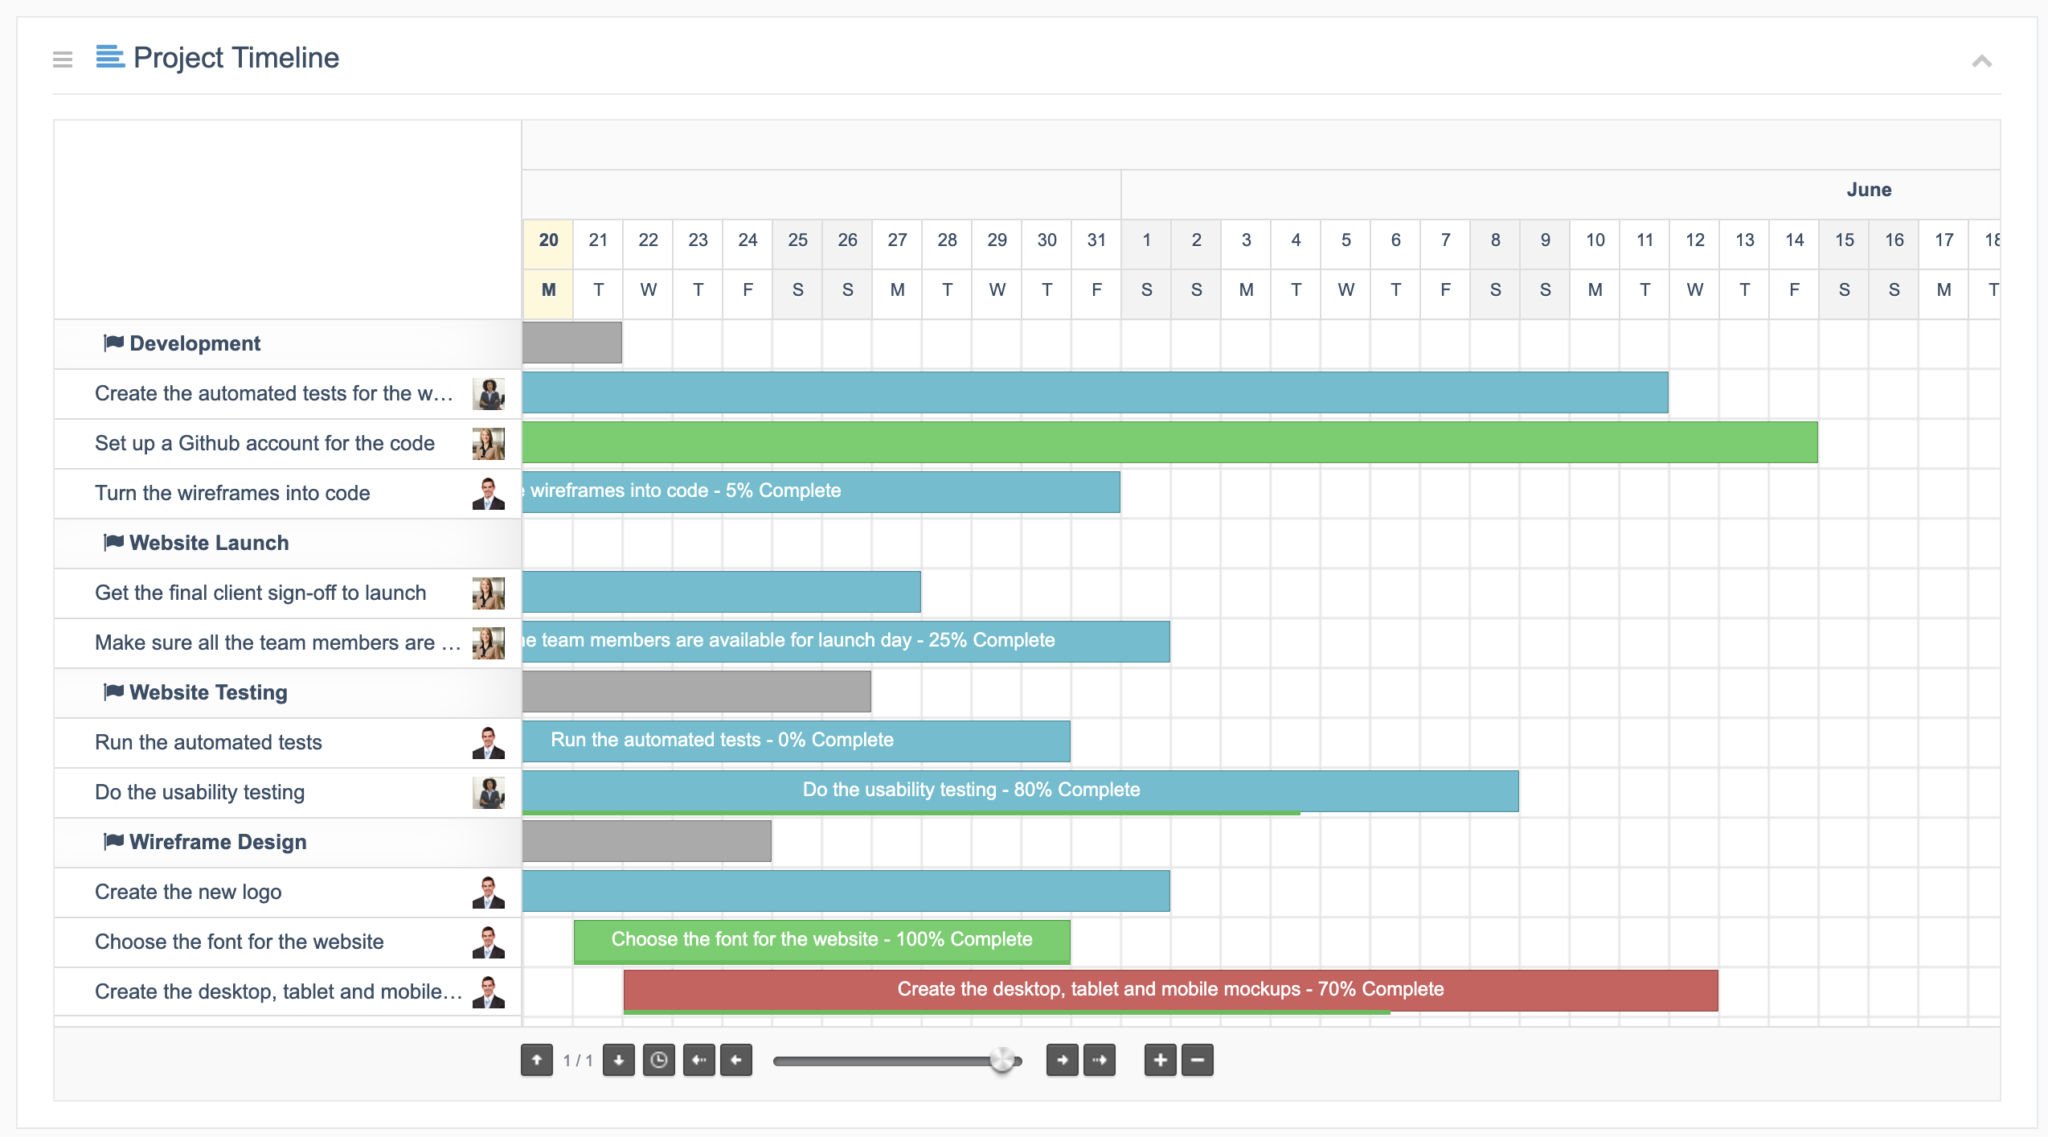
With the UpStream Reporting extension, you can create Gantt Charts, pie charts, bar graphs, calendars, tables, and more. Choose from dozens of built-in reports, and filter by any combinations of parameters or custom fields to zero in on the data that you want to see.
Reports - UpStream
UpStream Reporting includes dozens of built in reports, with filters for every parameter, allowing you to see your data in more ways than ever. With the UpStrea
Need update? Any questions?
Write 24/7:
Gmail : [email protected]
Whatsapp : https://wa.me/447490565423
Instagram : https://ig.me/m/mmolearn_com
Messenger : https://m.me/100085355035309
Skype : https://join.skype.com/invite/ATRdW9nB0bSh
Telegram : https://t.me/mmolearn
-
 UpStream Reporting Extension.jpg
 -
 mmolearn.png